 Ahmad
Ahmad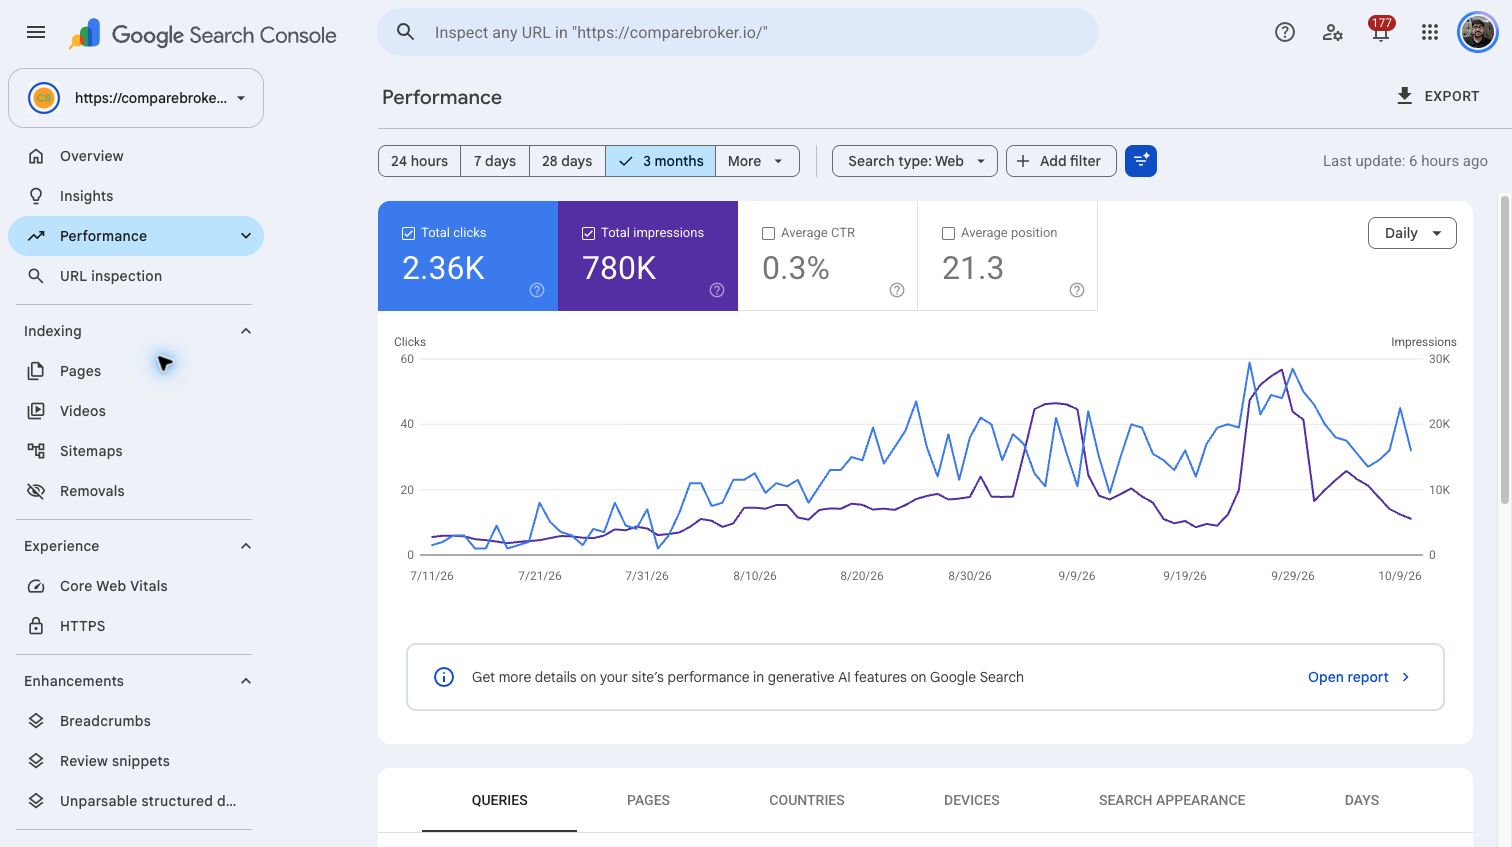
The search snapshot
The selected Web search report records 2.36K clicks and 780K impressions. Average click-through rate is 0.3%, with an average position of 21.3 across the report.
What the chart shows
The click line starts at a low daily level in July and reaches higher levels through August and September. Impressions show two distinct peaks before easing near the end. The chart shows growing click activity across the period, alongside uneven visibility.
Where to look next
Separate the pages gaining clicks from those driving the impression spikes. Query and landing-page comparisons would help explain which topics are reaching searchers and where visibility is not yet translating into visits.
Source: the supplied Search Console report, cross-checked in the authenticated property. These are site-wide search metrics; they do not measure sales or attribute results to a specific intervention.